[Japan] Famitsu sales for H1 2023 (Fiscal Year) (Top 10 Software, Hardware)
Last week, Koichi Hamamura (former editor-in-chief of Famitsu magazine and current Senior Advisor for Digital Entertainment at Kadokawa) held a seminar about the state of the video games industry. During that seminar, he shared some sales data from Famitsu for the video games market in Japan, covering the first half of the current Fiscal Year (namely, March 27th to September 24th 2023).
Software
First, there’s the Top 10 Software. The Nintendo Switch grabbed 8 of the 10 spots in the Top 10, with The Legend of Zelda: Tears of the Kingdom at #1. With 1,864,134 units sold, it’s the only game that sold over 1 million units during the first half of the year.
The only other new game in the Top 10 is Pikmin 4, which did sell over 1 million units… but only if you include digital sales. At retail, it still sold 864,229 units, shattering the previous record for the Pikmin series. And the game isn’t done selling!
Top 10 Software
01./00. [NSW] The Legend of Zelda: Tears of the Kingdom # <ADV> (Nintendo) {2023.05.12} (¥7.200) – 1.864.134 / NEW <80-100%>
02./00. [NSW] Pikmin 4 <ACT> (Nintendo) {2023.07.21} (¥5.980) – 864.229 / NEW <80-100%>
03./00. [PS5] Final Fantasy XVI # <RPG> (Square Enix) {2023.06.22} (¥9.000) – 418,122 / NEW <80-100%>
04./00. [NSW] Mario Kart 8 Deluxe <RCE> (Nintendo) {2017.04.28} (¥5.980) – 279,570 / 5.493.686 <80-100%>
05./00. [NSW] Minecraft # <ADV> (Microsoft Game Studios) {2018.06.21} (¥3.600) – 186,457 / 3.269.466 <80-100%>
06./00. [NSW] Pokemon Scarlet / Violet # <RPG> (Pokemon Co.) {2022.11.18} (¥5.980) – 177,631 / 5.137.268 <80-100%>
07./00. [NSW] Splatoon 3 <ACT> (Nintendo) {2022.09.09} (¥5.980) – 155,629 / 4.114.502 <80-100%>
08./00. [NSW] Kirby’s Return to Dream Land Deluxe <ACT> (Nintendo) {2023.02.24} (¥5.980) – 148,336 / 484.479 <80-100%>
09./00. [PS5] Armored Core VI: Fires of Rubicon # <ACT> (From Software) {2023.08.25} (¥7.900) – 147,154 / NEW <80-100%>
10./00. [NSW] Nintendo Switch Sports # <SPT> (Nintendo) {2022.04.29} (¥4.980) – 140,638 / 1.178.807 <80-100%>
# of games in the Top 10
NSW – 10
PS5 – 2
Market share
During the first half of the Fiscal Year, the majority of Software sales were on Nintendo Switch. Nearly 7 million units of Software were sold, which is a noticeable drop from the 9.1 million units sold during the first half of the previous Fiscal Year.
+-------+------------+------------+
|System | This H1-FY | Last H1-FY |
+-------+------------+------------+
|  NSW  |  6.833.068 |  9.108.056 |
|  PS5  |  1.150.936 |    441.293 |
|  PS4  |    609.730 |  1.002.806 |
|  OTH  |     31.067 |     27.068 |
+-------+------------+------------+
|  ALL  |  8.624.801 | 10.579.223 |
+-------+------------+------------+
Hardware
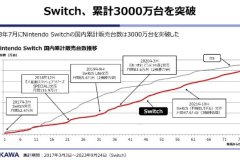
Hardware-wise, Nintendo Switch have finally surpassed 30 million units: a feat only achieved by two other consoles (the Nintendo DS and the Game Boy series). As mentioned several times before, the Nintendo Switch is virtually guaranteed to become the best-selling console of all time in Japan… quite the comeback after the failure of the Wii U!
Also, sales actually went up during the first half of the current Fiscal Year, thanks in great part to the healthy boost provided by the launch of The Legend of Zelda: Tears of the Kingdom.
+-------+------------+------------+-------------+
|System | This H1-FY | Last H1-FY |     LTD     |
+-------+------------+------------+-------------+
| NSW # |  2.111.537 |  2.015.982 |  30.715.392 |
| PS5 # |  1.207.627 |    457.686 |   4.408.983 |
| XBS # |     73.364 |    186.137 |     507.539 |
| PS4 # |     35.379 |        490 |   9.473.176 |
| 3DS # |      1.298 |      4.406 |  24.600.561 |
+-------+------------+------------+-------------+
|  ALL  |  3.429.205 |  2.664.701 |  70.898.026 |
+-------+------------+------------+-------------+
|  PS5  |  1.071.558 |    413.060 |   3.829.395 |
| PS5DE |    136.069 |     44.626 |     579.588 |
| XBS X |     38.802 |     71.104 |     222.187 |
| XBS S |     34.562 |    115.033 |     285.352 |
|NSWOLED|  1.550.959 |  1.188.144 |   5.655.892 |
| NSW L |    248.844 |    246.824 |   5.505.765 |
|  NSW  |    311.734 |    581.014 |  19.553.735 |
|  PS4  |     35.379 |        490 |   7.897.453 |
|n-2DSLL|      1.298 |      4.406 |   1.205.616 |
+-------+------------+------------+-------------+
Here’s a chart showing the evolution of Nintendo Switch sales over the years, and comparing them to Nintendo DS sales:
- Launch month (March 2017)
- December 2018 (Super Smash Bros. Ultimate launch)
- September 2019 (Nintendo Switch Lite launch)
- March 2020 (Animal Crossing: New Horizons launch)
- October 2021 (Nintendo Switch OLED Model launch)
Market Value
Overall, the Japanese video games market fared rather well during the first half of the current Fiscal Year. Hardware sales saw a big jump (thanks to the competition), while Software sales are slightly down. Overall, the big increase in Hardware sales allowed total market value to reach 186.23 million Yen.
+-------+------------+------------+
|       | This H1-FY | Last H1-FY |
+-------+------------+------------+
|  H-W  |   131.510  |     88.660 |
|  S-W  |    54.720  |     63.150 |
|  TOT  |   186.230  |    151.820 |
+-------+------------+------------+
Click here for more Japanese sales!
Source: ASCII Games
Data compiled by: Chris1964 (Install Base)


