Famitsu: Japanese sales data for past Fiscal Year (April 2022 – March 2023) [Hardware, Software]
During its yearly seminar, held on May 24th, Koichi Hamamura (Senior Advisor for Digital Entertainment at Kadokawa) shared some data about the Japanese video games market during the past fiscal Year (March 28th 2022 to March 25th 2023 to be precise).
During the past Fiscal Year, the Japanese video games market saw a slight increase in sales, in great part due to Sony finally getting the PS5 shortages sorted. Hardware sales did increase, while overall, Software sales were relatively stable.
+-------+------------+------------+
|System |  This FY   |  Last FY   |
+-------+------------+------------+
|  H-W  |    226.410 |    192.640 |
|  S-W  |    151.530 |    156.710 |
|  TOT  |    377.940 |    349.350 |
+-------+------------+------------+
Hardware-wise, the Nintendo Switch was once again the best-selling console in Japan, though sales are down Year on Year. It’s pretty safe to say Nintendo Switch sales have peaked. While the console clearly has lots of fuel left in the tank, its sales are going to follow an inevitably downward trajectory moving forward. It will reach the 30 million units milestone within the next few months.
+-------+------------+------------+-------------+
|System |  This FY   |  Last FY   |     LTD     |
+-------+------------+------------+-------------+
| NSW # |  4.326.744 |  5.191.763 |  28.603.855 |
| PS5 # |  1.703.839 |    917.306 |   3.201.356 |
| XBS # |    269.885 |    124.281 |     434.175 |
| PS4 # |     42.682 |     44.336 |   9.437.797 |
| 3DS # |      6.733 |     24.220 |  24.599.263 |
+-------+------------+------------+-------------+
|  ALL  |  6.349.883 |  6.301.906 |  67.467.523 |
+-------+------------+------------+-------------+
|  PS5  |  1.486.087 |    786.274 |   2.757.837 |
| PS5DE |    217.752 |    131.032 |     443.519 |
| XBS X |     94.154 |     58.595 |     183.385 |
| XBS S |    175.731 |     65.686 |     250.790 |
|NSWOLED|  2.614.581 |  1.490.352 |   4.104.933 |
| NSW L |    608.535 |  1.121.403 |   5.256.921 |
|  NSW  |  1.103.628 |  2.580.008 |  19.242.001 |
|  PS4  |     42.682 |     44.336 |   7.862.074 |
|n-2DSLL|      6.733 |     24.220 |   1.204.318 |
+-------+------------+------------+-------------+
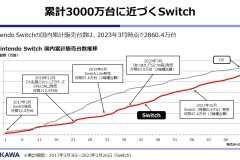
Here’s a graph showing the sales trajectory of the Nintendo Switch since launch:
This year again, all the games in the Top 10 Software are Nintendo Switch titles:
01./00. [NSW] Pokemon Scarlet / Violet # <RPG> (Pokemon Co.) {2022.11.18} (¥5.980) – 4.959.637 / NEW
02./00. [NSW] Splatoon 3 <ACT> (Nintendo) {2022.09.09} (¥5.980) – 3.958.873 / NEW
03./00. [NSW] Nintendo Switch Sports # <SPT> (Nintendo) {2022.04.29} (¥4.980) – 1.038.169 / NEW
04./05. [NSW] Mario Kart 8 Deluxe <RCE> (Nintendo) {2017.04.28} (¥5.980) – 695.643 / 5.214.116 (-9%)
05./00. [NSW] Kirby and the Forgotten Land <ACT> (Nintendo) {2022.03.25} (¥5.980) – 631.451 / 1.011.511 (+66%)
06./06. [NSW] Minecraft # <ADV> (Microsoft Game Studios) {2018.06.21} (¥3.600) – 508.285 / 3.083.009 (-28%)
07./00. [NSW] Kirby’s Return to Dream Land Deluxe <ACT> (Nintendo) {2023.02.24} (¥5.980) – 336.143 / NEW
08./08. [NSW] Super Smash Bros. Ultimate # <FTG> (Nintendo) {2018.12.07} (¥7.200) – 327.867 / 5.150.490 (-46%)
09./00. [NSW] Monster Hunter Rise + Sunbreak Set <Monster Hunter Rise \ Monster Hunter Rise: Sunbreak> <ACT> (Capcom) {2022.06.30} (¥7.990) – 316.070 / NEW
10./00. [NSW] Dragon Quest Treasures # <RPG> (Square Enix) {2022.12.09} (¥7.264) – 280.369 / NEW
Numbers of games in Top 10
NSW – 10
And here’s the Top 10 Software for the Nintendo specifically (total sales since launch):
01./00. [NSW] Animal Crossing: New Horizons # <ETC> (Nintendo) {2020.03.20} (¥5.980) – 7.447.819
02./00. [NSW] Mario Kart 8 Deluxe <RCE> (Nintendo) {2017.04.28} (¥5.980) -5.214.116
03./00. [NSW] Super Smash Bros. Ultimate # <FTG> (Nintendo) {2018.12.07} (¥7.200) – 5.140.490
04./00. [NSW] Pokemon Scarlet and Violet <RPG> (Pokemon Co.) {2022.11.18} (¥5.980) – 4.959.637
05./00. [NSW] Pokemon Sword # <RPG> (Pokemon Co.) {2019.11.15} (¥5.980) – 4.401.610
06./00. [NSW] Splatoon 2 # <ACT> (Nintendo) {2017.07.21} (¥5.980) – 4.131.980
07./00. [NSW] Splatoon 3 <ACT> (Nintendo) {2022.09.09} (¥5.980) – 3.958.873
08./00 [NSW] Ring Fit Adventure # <HOB> (Nintendo) {2019.10.18} (¥7.980) – 3.367.061
09./00. [NSW] Minecraft # <ADV> (Microsoft Game Studios) {2018.06.21} (¥3.600) – 3.083.009
10./00. [NSW] Momotaro Dentetsu: Showa, Heisei, Reiwa mo Teiban! <TBL> (Konami) {2020.11.19} (¥6.300) – 2.859.041
Koichi Hamamura points out that it’s not just new games that sell well: older titles also enjoyed strong sales. This is partly due to the frequent release of DLC / Expansion Pass content, which receive the same amount of promotion as brand new titles.
Click here for more Japanese sales data!
Source: Famitsu
Some data compiled by: Chris1964 (Install Base)


