Japan: more sales data for Week 2 2019, New Super Mario Bros. U Deluxe, Holiday Season 2018 (Media Create, Dengeki)
Here’s the latest sales data reports from Media Create and Dengeki!
Media Create (Week 2)
Today, Media Create shared their weekly report on video games sales in Japan. It reveals that Software sales topped 594 000 units, which is 53.26% of Week 1 sales. That massive drop was expected, due to the end of the holiday season. Hardware sales were not spared: they dropped to 104 000 units (29.84% of Week 1 sales).
But despite that drop, the market is still significantly up Year on Year, Software-wise (123.29% of Week 1 2018 sales). On the other hand, Hardware sales are flat (101.13% of Week 1 2018 sales). Most of that increase is due to the Nintendo Switch, with Hardware and Software sales up Year on Year by a wide margin. Nintendo’s console is, once again, pulling the market up.
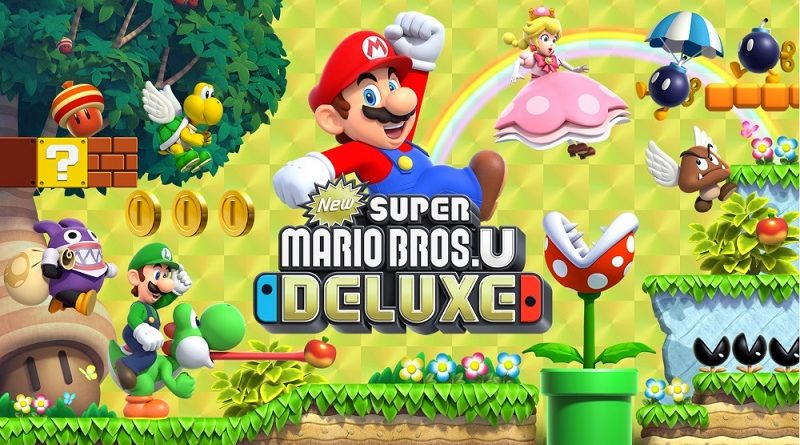
New Super Mario Bros. U Deluxe did pretty well at launch, with 166 000 units sold. Both Nintendo and retailers were prepared and shipped / ordered enough copies to meet demand: sell-through ratio is 52.53%. While this may seem quite low, it’s really no big deal as retailers will have absolutely no trouble selling the remaining copies within the next few weeks.
In comparison, New Super Mario Bros. U sold about 166 000 units at launch (which also happened to be on the Wii U launch day). In other words, New Super Mario Bros. U Deluxe outsold it… not bad for a port (which usually sell a significantly lower amount the original version, especially without much new content), and outside the holiday season (the original was released in December).
The sell-through ratio is quite similiar: 55.32%, which shows that retailers see Mario as a “safe” value, as something they know will sell no matter what.
Source: Media Create
Media Create – Day 1 Sell-through (Week 3)
No data this week, unfortunately.
Dengeki (Week 2)
Dengeki report that New Super Mario Bros. U Deluxe is the one game that managed to make Super Smash Bros. Ultimate drop from the top spot of the Top 50, that it had been monopolizing since launch. They report higher sales than Media Create: about 179 000 units, with a higher sell-through ratio (60%).
While this may seem a bit low (it certainly is by New Super Mario Bros. standards, but that’s a remake for you), 2D Mario platforms have consistently sold over 1 million units, so there’s really nothing to worry about with this one in particular.
As for Tales of Vesperia: Definitive Edition, it sold about 80 000 units at launch, with about 28 000 units on Nintendo Switch (46 000 units on PlayStation 4). The sell-through ratio is quite good: 80%, which is a positive as JRPG always tend to sell the most during the first couple of weeks (what’s more, past Tales of games have seen a sharp drop during their second week, reaching over 90%).
Unfortunately, Dengeki do not provide sell-through for each version individually, which would have been an interesting metric given the shortages the Nintendo Switch version suffered (and is still suffering) from.
Finally, Super Smash Bros. Ultimate sold 67 000 additional units, bringing total sales to 2.74 million units.
This week, Dengeki also shared data about the holiday season (no dates provided, but presumably November 1st to January 6th like last week), with the market share of the various publishers.
To say that Nintendo dominated sales is quite the understatement: the company overwhelmed the competition, with a 50.4% market share. In other words, over 1/2 of all games sold during the holiday seasons were all from Nintendo… and that doesn’t even include Pokémon games, published by The Pokémon Company in Japan! Of course, that great performance is mostly due to the equally great sales of Super Smash Bros. Ultimate.
Speaking of Pokémon, The Pokémon Company was the second most successful publisher, with a 16.1% market share. Bandai-Namco is 3rd with 6.5% market share earned thanks to God Eater 3 and Taiko no Tatsujin: Drum ‘n’ Fun. Square-Enix is 4th, with a 5.2% market share (thanks to Dragon Quest Builders 2), while SEGA is 5th with 3.4% (thanks to Judgement).
Combined, the Top 5 publishers account for about 80% of total Software sales during the holiday season, leaving only scraps to the others.
It’s the 3rd year in a row that the market is on the rise during the holiday season, and looking only at raw numbers, it does seem like a satisfactory result. However, the reality is quite different for the other publishers, especially those that did not have a major hit to carry sales.
Next, here’s Software sales for each platform:
| Platforms | This week | This week (%) | Fiscal Year | Fiscal Year (%) |
| PS4 | 121,343 | 20.9% | 6,604,440 | 30.8% |
| Vita | 5,721 | 1.0% | 706,821 | 3.3% |
| Switch | 428,393 | 73.8% | 12,112,155 | 56.5% |
| 3DS | 23,981 | 4.1% | 1,927,631 | 9.0% |
| ETC | 1,201 | 0.2% | 75,523 | 0.4% |
| Total | 580,639 | 100.0% | 21,426,570 | 100.0% |
And here’s Hardware sales:
| Platforms | This week | This week (%) | Fiscal Year | Fiscal Year (%) |
| PS4 | 18,098 | 15.8% | 1,183,751 | 24.0% |
| Vita | 1,712 | 1.5% | 101,526 | 2.1% |
| Switch | 89,993 | 78.4% | 3,262,283 | 66.1% |
| 3DS | 4,755 | 4.1% | 381,103 | 7.7% |
| ETC | 168 | 0.1% | 8,137 | 0.2% |
| Total | 114,726 | 100.0% | 4,936,800 | 100.0% |
Finally, here’s the Top 50 Software:
01./00. [NSW] New Super Mario Bros. U Deluxe (Nintendo) {2019.01.11} – 178,512 / NEW
02./01. [NSW] Super Smash Bros. Ultimate (Nintendo) {2018.12.07} – 64,261 / 2,736,743
03./00. [PS4] Tales of Vesperia: Definitive Edition (Bandai Namco Games) {2019.01.11} – 45,703 / NEW
04./00. [NSW] Tales of Vesperia: Definitive Edition (Bandai Namco Games) {2019.01.11} – 27,920 / NEW
05./02. [NSW] Super Mario Party (Nintendo) {2018.10.05} – 19,756 / 894,334
06./04. [NSW] Minecraft (Microsoft Game Studios) {2018.06.21} – 14,306 / 621,746
07./07. [NSW] Dragon Quest Builders 2 (Square Enix) {2018.12.20} – 13,353 / 194,783
08./03. [NSW] Mario Kart 8 Deluxe (Nintendo) {2017.04.28} – 12,750 / 2,002,777
09./05. [NSW] Splatoon 2 (Nintendo) {2017.07.21} – 10,863 / 2,885,976
10./09. [PS4] Dragon Quest Builders 2 (Square Enix) {2018.12.20} – 10,381 / 181,297
11./10. [NSW] Go Vacation (Bandai Namco Games) {2018.12.27} – 8,431 / 48,754
12./06. [NSW] Pokemon: Let’s Go, Pikachu! (Pokemon Co.) {2018.11.16} – 8,150 / 748,846
13./08. [NSW] Pokemon: Let’s Go, Eevee! (Pokemon Co.) {2018.11.16} – 6,975 / 597,186
14./13. [NSW] The Legend of Zelda: Breath of the Wild (Nintendo) {2017.03.03} – 6,481 / 932,842
15./11. [PS4] Judgment (Sega) {2018.12.13} – 6,030 / 241,904
16./19. [PS4] Call of Duty: Black Ops IIII (Sony Interactive Entertainment) {2018.10.12} – 4,063 / 511,025
17./12. [NSW] Taiko no Tatsujin: Drum ‘n’ Fun! (Bandai Namco Games) {2018.07.19} – 3,872 / 305,702
18./16. [PS4] God Eater 3 (Bandai Namco Games) {2018.12.13} – 3,739 / 199,795
19./14. [NSW] Super Mario Odyssey (Nintendo) {2017.10.27} – 3,269 / 1,799,559
20./15. [NSW] Kirby Star Allies (Nintendo) {2018.03.16} – 2,850 / 717,265
21./35. [PS4] Kingdom Hearts HD I.5 + II.5 ReMIX (Square Enix) {2017.03.09} – 2,663 / 235,527
22./27. [NSW] Fit Boxing (Imagineer) {2018.12.20} – 2,628 / 11,924
23./39. [NSW] Diablo III: Eternal Collection (Blizzard Entertainment) {2018.12.27} – 2,411 / 15,234
24./20. [3DS] Mario & Luigi: Bowser’s Inside Story + Bowser Jr.’s Journey (Nintendo) {2018.12.27} – 2,269 / 21,058
25./32. [PS4] Onimusha: Warlords (Capcom) {2018.12.20} – 2,063 / 33,544
26./23. [PS4] Battlefield V (Electronic Arts) {2018.11.20} – 2,019 / 161,854
27./18. [NSW] Mario Tennis Aces (Nintendo) {2018.06.22} – 1,872 / 407,682
28./28. [NSW] Katamari Damacy Reroll (Bandai Namco Games) {2018.12.20} – 1,727 / 22,424
29./22. [NSW] Dragon Ball FighterZ (Bandai Namco Games) {2018.09.27} – 1,581 / 78,201
30./25. [NSW] FIFA 19 (Electronic Arts) {2018.09.28} – 1,511 / 65,989
31./58. [PS4] Grand Theft Auto V (Take-Two Interactive Japan) {2018.12.06} – 1,483 / 9,479
32./37. [NSW] Super Run For Money Tousouchuu & Super Battle For
Money Sentouchuu Double Pack (Bandai Namco Games) {2018.11.29} – 1,440 /
27,800
33./48. [PS4] Dead by Daylight (3goo) {2018.11.29} – 1,427 / 21,239
34./30. [NSW] Fortnite (Warner Entertainment Japan) {2018.12.13} – 1,422 / 16,013
35./42. [PS4] Minecraft: Playstation 4 Edition (Sony Interactive Entertainment) {2015.12.03} – 1,320 / 356,378
36./54. [3DS] Animal Crossing: New Leaf – Welcome amiibo (Nintendo) {2016.11.23} – 1,244 / 406,022
37./24. [NSW] Captain Toad: Treasure Tracker (Nintendo) {2018.07.13} – 1,233 / 176,526
38./26. [3DS] Luigi’s Mansion (Nintendo) {2018.11.08} – 1,117 / 88,817
39./46. [3DS] Pokemon Ultra Moon (Pokemon Co.) {2017.11.17} – 1,078 / 865,166
40./21. [PS4] Winning Eleven 2019 (Konami) {2018.08.30} – 1,067 / 159,389
41./68. [PS4] Red Dead Redemption II (Take-Two Interactive Japan) {2018.10.26} – 1,060 / 211,897
42./59. [PS4] Monster Hunter: World [Best Price] (Capcom) {2018.08.02} – 1,040 / 23,059
43./40. [3DS] Pokemon Ultra Sun (Pokemon Co.) {2017.11.17} – 994 / 893,353
44./83. [PS4] Tom Clancy’s Rainbow Six: Siege – Advanced Edition (Ubisoft) {2018.03.01} – 908 / 86,809
45./49. [NSW] Onimusha: Warlords (Capcom) {2018.12.20} – 906 / 17,620
46./56. [PS4] Just Cause 4 (Square Enix) {2018.12.06} – 833 / 32,611
47./38. [NSW] Billion Road (Bandai Namco Games) {2018.11.29} – 819 / 15,475
48./104. [PS4] Kingdom Hearts HD II.8 Final Chapter Prologue (Square Enix) {2017.01.12} – 800 / 210,602
49./31. [NSW] Pro Baseball Famista Evolution (Bandai Namco Games) {2018.08.02} – 744 / 125,835
50./43. [NSW] Donkey Kong Country: Tropical Freeze (Nintendo) {2018.05.03} – 735 / 238,218
Source: Dengeki
Data compiled by: ZSaberLink (ResetERA)
Click here for more Japanese sales data!

