Japan: Famitsu sales for First Half of Fiscal Year (March 29th – September 26th 2021)
Famitsu have shared an additional report for video games sales in Japan this week. It covers the first half of the current Fiscal Year, and more precisely the period going from March 29th to September 26th 2021.
Unsurprisingly, the Nintendo Switch dominated Software sales, as you can see in the Top 10 Software below. Quite interestingly, the evergreen titles sold more than new releases; the best-selling entry is New Pokémon Snap at #7. Monster Hunter Rise is #1 with over 1 million units sold, and owes that ranking to its late March release.
01./00. [NSW] Monster Hunter Rise # <ACT> (Capcom) {2021.03.26} (¥7.990) – 1.023.925 / 2.326.057
02./03. [NSW] Ring Fit Adventure # <HOB> (Nintendo) {2019.10.18} (¥7.980) – 363.559 / 2.843.132 (-58%)
03./00. [NSW] Minecraft # <ADV> (Microsoft Game Studios) {2018.06.21} (¥3.600) – 332.116 / 2.204.855
04./06. [NSW] Mario Kart 8 Deluxe <RCE> (Nintendo) {2017.04.28} (¥5.980) – 311.653 / 4.063.247 (-9%)
05./00. [NSW] Momotaro Dentetsu: Showa, Heisei, Reiwa mo Teiban! <TBL> (Konami) {2020.11.19} (¥6.300) – 309.386 / 2.381.682
06./00. [NSW] Super Mario 3D World + Bowser’s Fury <ACT> (Nintendo) {2021.02.12} (¥5.980) – 297.898 / 890.581
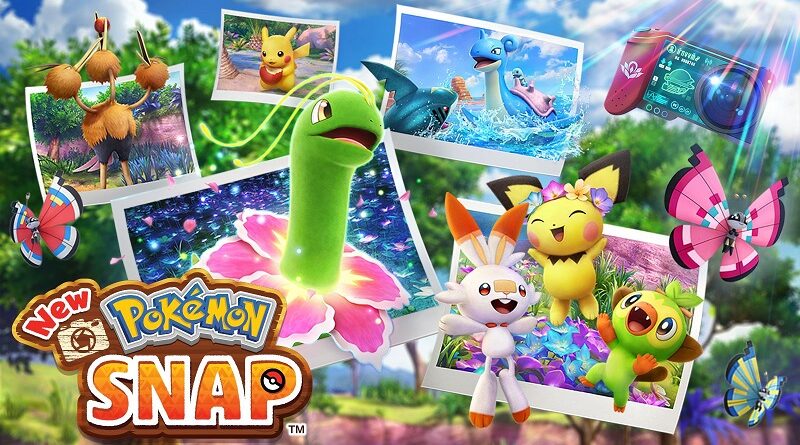
07./00. [NSW] New Pokemon Snap <ACT> (Pokemon Co.) {2021.04.30} (¥5.980) – 282.058 / NEW
08./00. [NSW] The Legend of Zelda: Skyward Sword HD <ADV> (Nintendo) {2021.07.16} (¥5.980) – 267.332 / NEW
09./00. [NSW] Miitopia <SLG> (Nintendo) {2021.05.21} (¥4.980) – 248.003 / NEW
10./00. [NSW] Game Builder Garage <EDU> (Nintendo) {2021.06.11} (¥3.164) – 239.178 / NEW
Number of games in Top 10
NSW – 10
But it’s not just the Top 10 that Nintendo Switch software dominated: Nintendo’s console sold nearly 4 times more games than all other platforms combined. It’s not really farfetched to say that the Nintendo Switch is the only truly viable platform left in Japan, what with the PlayStation 4 on the way out and the PlayStation 5 failing to take off.
During the first half of the current Fiscal Year, a total of 8 238 535 games were sold on Nintendo Switch, which is a little over 1 million units less than last year during the same period. But despite that drop, it’s fairly safe to say that Nintendo Switch sales remained particularly strong during the first half of the current Fiscal Year, especially given the lack of mega hit like Animal Crossing: New Horizons.
Unfortunately, the market as a whole is down with “only” 10.5 million units sold (down from 13.3 million units last year). As popular as it may be, the Nintendo Switch cannot really carry the whole market on its own!
+-------+------------+------------+-------------+
|System | This H1-FY | Last H1-FY |     LTD     |
+-------+------------+------------+-------------+
|  NSW  |  8.238.535 |  9.101.669 |             |
|  PS4  |  1.806.817 |  4.091.877 |             |
|  PS5  |    416.755 |            |     596.405 |
|  OTH  |     26.363 |    125.166 |             |
+-------+------------+------------+-------------+
|  ALL  | 10.488.470 | 13.318.712 |             |
+-------+------------+------------+-------------+
Hardware-wise, Nintendo Switch sales are slightly down with 2 119 677 units sold (down from 2 253 733 units last year). Sales remained unexpectedly strong, especially without a mega hit like Animal Crossing: New Horizons to boost sales.
The OG model was by far the most popular with 1 574 903 units sold, as opposed to 544 774 units for the Lite model. And since the OLED model is extremely hard to find in stores, it’s more than likely than the OG model will outsell it during the second half of the current Fiscal Year.
A new milestone was reached: the Nintendo Switch has now sold over 21 million units, with 17 133 268 units for the original model and 4 071 757 units for the Lite model.
Finally, Nintendo 3DS sales were pretty anemic with only 13 947 units sold (not really a surprise given all models have now been discontinued). This brings total sales to 24 582 223 units.
+-------+------------+------------+-------------+
|System | This H1-FY | Last H1-FY |     LTD     |
+-------+------------+------------+-------------+
| NSW # |  2.119.677 |  2.253.733 |  21.205.025 |
| PS5 # |    491.985 |            |   1.072.196 |
| XBS # |     55.000 |            |      95.009 |
| PS4 # |     36.517 |    303.755 |   9.387.296 |
| 3DS # |     13.947 |     37.686 |  24.582.223 |
+-------+------------+------------+-------------+
|  ALL  |  2.717.126 |  2.596.918 |  57.515.820 |
+-------+------------+------------+-------------+
|  PS5  |    412.626 |            |     898.102 |
| PS5DE |     79.359 |            |     174.094 |
| XBS X |     31.749 |            |      62.385 |
| XBS S |     23.251 |            |      32.624 |
| NSW L |    544.774 |    665.529 |   4.071.757 |
|  NSW  |  1.574.903 |  1.588.204 |  17.133.268 |
|  PS4  |     36.517 |    193.186 |   7.811.573 |
|n-2DSLL|     13.947 |     35.913 |   1.187.278 |
+-------+------------+------------+-------------+
Click here for more Japanese sales!
Source: Famitsu
Data compiled by: Chris1964 (Install Base)

